
From the end of May 2022 to the end of March 2023, the low-cost air quality sensors (measuring NO2, O3, PM10 and PM2.5), a meteorological mast (MM for measuring temperature, relative humidity, wind direction and speed below the level of roofs), a portable aerosol Doppler LIDAR (LDR for measuring vertical profiles of wind direction and speed and aerosol layers) and a microwave radiometer (MWR for measuring vertical temperature stratification of the atmosphere) were placed within streets Legerova, Sokolská, Rumunská a their surroudings. Furthermore, the data from the professional meteorological and climatological station Prague Karlov (MS located on the roof of the MFF UK building in Prague) and from the reference traffic station for air quality monitoring Prague Legerova (RM, where one control sensor S4 was co-located). See Fig. 1 for individual devices placement within the whole area of interest.
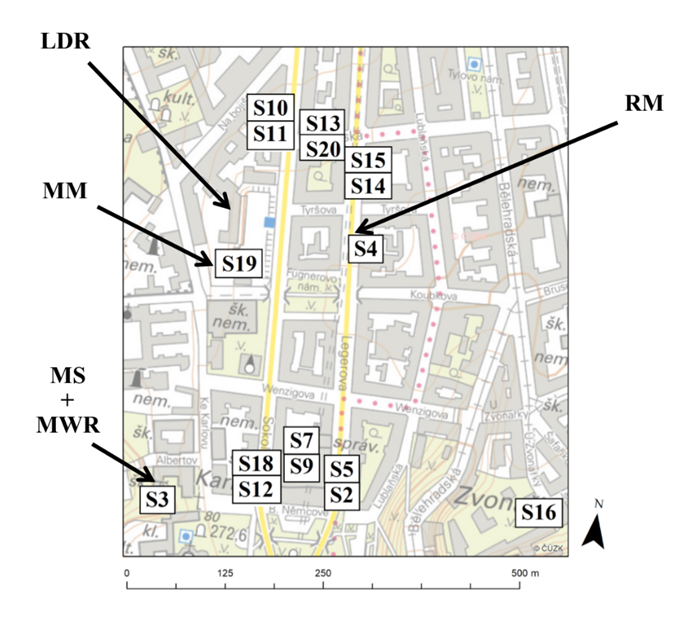 Fig. 1. Map of the individual devices placement within the TURBAN project. S = low-cost sensors for air quality monitoring, LDR = Doppler lidar, MM = mobile meteorological mast, MWR = microwave radiometer, MS = meteorological and climatological station Prague Karlov, RM = reference traffic station for air quality monitoring Prague Legerova.
 When interpreting data measured by low-cost sensors, it is always necessary to remember that these devices are characterized by relatively high inaccuracy. For this reason, it is also generally recommended to focus on measured concentration trends rather than absolute concentration values. Since the goal of this project was to obtain the most relevant data on air quality in various places and heights in the locality of interest, it was necessary to continuously check the quality of the measured data and then apply appropriate mathematical corrections.
In addition to the course of hourly concentrations in selected periods, maps with medians and maxima of average hourly concentrations, especially NO2 and PM10, evaluated over the entire measurement period at the monitored locations are also presented. The maximum concentrations represent the upper range of recorded pollution in this area, but they may be influenced by intensive but less representative activities that cannot be retrospectively excluded from the data (emissions from cigarette smoke, parking of supply and delivery cars near sensors, etc.). In contrast, concentration medians provide a better indication of the long-term state of pollution in the locality. The median is the middle value that divides the data set into two (equally large) halves, and is therefore not affected by outliers or possible random phenomena compared to the common average.
In the case of measuring nitrogen dioxide (NO2), which is one of the primary emission outputs from transport, a change in the trend of NO2 concentrations was noticeable during the working days, when there is a high traffic intensity in the streets, and during the weekend, when car traffic in these streets is lower. Furthermore, the effect of the morning and afternoon rush hours was clearly visible on working days (in the hours between 6:00 a.m. and 10:00 a.m. and 4:00 p.m. and 8:00 p.m., both UTC time; Fig. 2). Sensors in Sokolská street at the crossroad with Rumunská (S10 and S11), sensors in Legerova street at the crossroad with Rumunská (S14 and S15) and sensors in Rumunská street (S20 and S13; see medians of NO2 concentrations for the entire measurement period in Fig. 3). Lower concentrations were then recorded in the case of sensors located on the school building in Legerova and Sokolská streests near the Nuselský bridge (S2, S5, S12 and S18; probably the result of good ventilation from the open space). The lowest concentrations were measured in the so-called background locations (more distant from the traffic emission source), i.e. sensor on the roof of the MFF UK in Ke Karlovu street (S3), sensor on the roof of Le Palais Art Hotel Prague in U Zvonařky street (S16), sensor placed in the area of the water reservoir at Karlov (S19) and further two sensors placed within the closed courtyard of the VĚDA school (S7 and S9; Fig. 2 and Fig. 3).
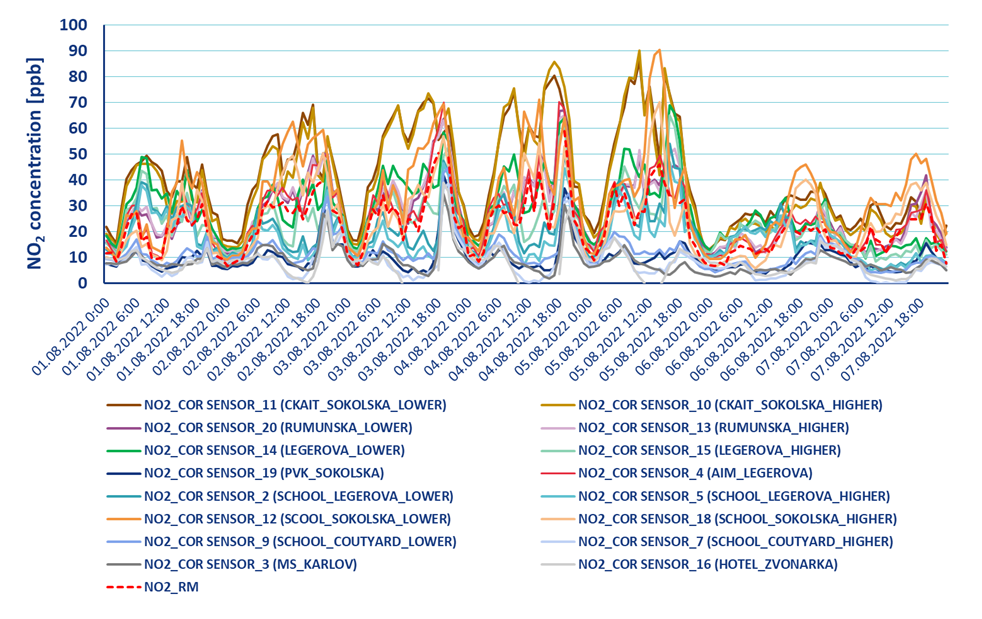 Fig. 2. The course of NO2 concentrations (ppb) during the days 1/8/2022 – 7/8/2022 (MON – SUN), when on working days there is an increased intensity of traffic in Legerova, Sokolská and Rumunská streets.
 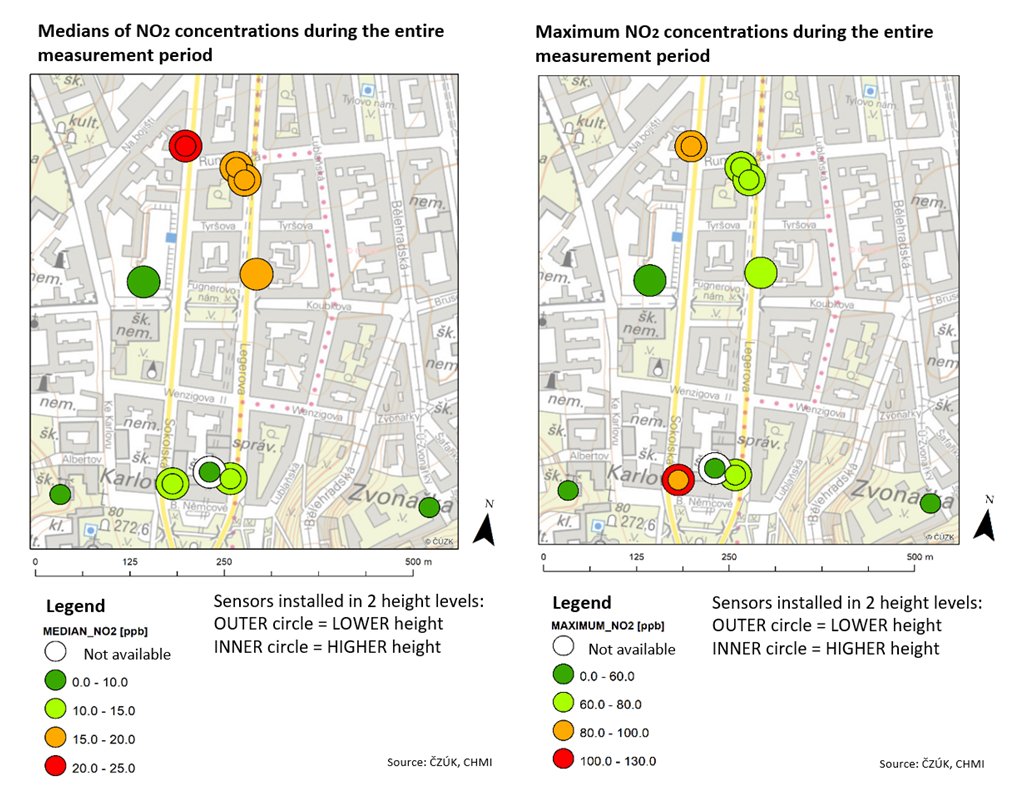 Fig. 3. Map with measurement points showing medians of hourly NO2 concentrations (ppb; left) and maximum hourly NO2 concentrations (ppb; right) detected during the entire measurement period (from June 2022 to March 2023). The sensors were placed in two height levels at six locations (see legend). The boundaries of the color scales in the map differ between medians and maximum concentrations.
 In the case of aerosol particle pollution, the measurement also showed a difference between working days and the weekend (Figs. 4 and 5). However, in general, no extremely high levels of PM10 or PM2.5 pollution were recorded in this area, despite the high traffic load on these streets. The explanation may be the fact that transport is not the main source of PM10 and PM2.5 particles in the Czech Republic, unlike nitrogen oxides (NOX; see Fig. 6). Transport can produce particles of a smaller size fraction (PM2.5, PM1and smaller), which can be emitted from the incomplete combustion of engines. Furthermore, emissions from brake and tire abrasion, which are part of PM2.5 and larger particles. A significant proportion of pollution here is made up of coarse particles (again PM10 and larger), which settle on the road surface for a long time and thus to their repeated resuspension (see secondary dust from traffic, Fig. 6). A similar course of concentrations was also recorded at other reference stations equipped with the same measurement technology (equivalent optoelectronic method using FIDAS200, Palas), but less loaded with traffic (see Fig. 7, comparison with the location Prague Šrobárova and Prague Řeporyje).
The sensors placed in Sokolská Street at the crossroad with Rumunská (S10 and S11), sensors in Legerova Street at the crossroad with Rumunská (S14 and S15) and sensors in Rumunská Street (S20 and S13; see medians of PM10 concentrations for the entire measurement period) were again the most loaded locations (Fig. 8). On the contrary, the sensors placed on the school building at the exit to the Nuselský bridge and the sensors placed in the background locations were less loaded (similarly as in case of NO2 pollution).
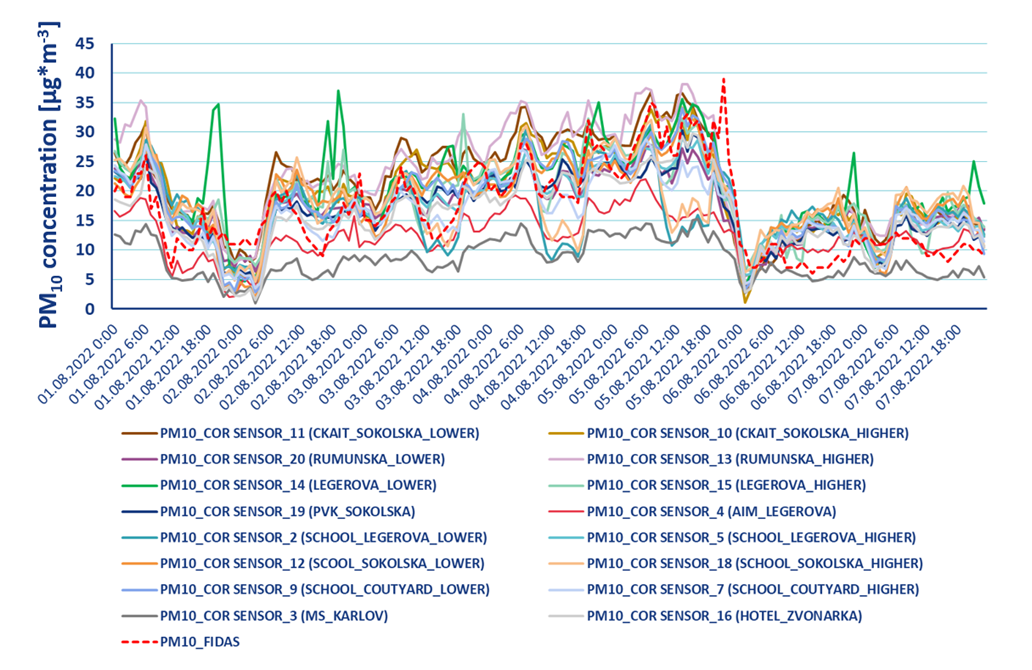 Fig. 4. Course of PM10 concentration (µg.m-3) on 1/8/2022 – 7/8/2022 (MON – SUN), when the difference between working days and the weekend is noticeable.
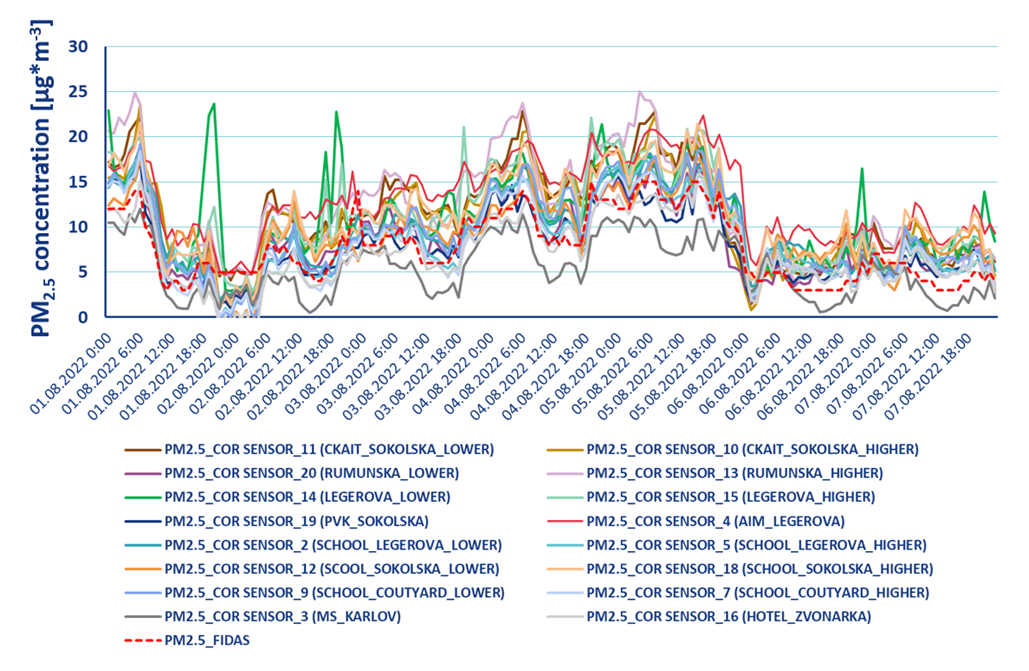 Fig. 5. Course of PM2.5 concentration (µg.m-3) on 1/8/2022 – 7/8/2022 (MON – SUN), when the difference between working days and the weekend is noticeable.
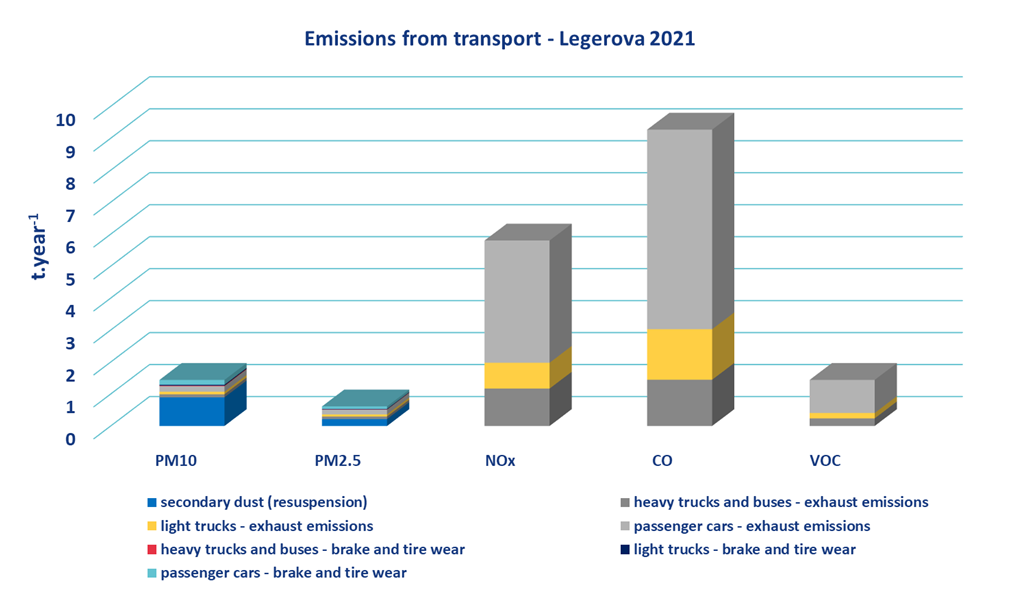 Fig. 6. Emissions of selected pollutants from transport, Legerova Street (Prague), year 2021.
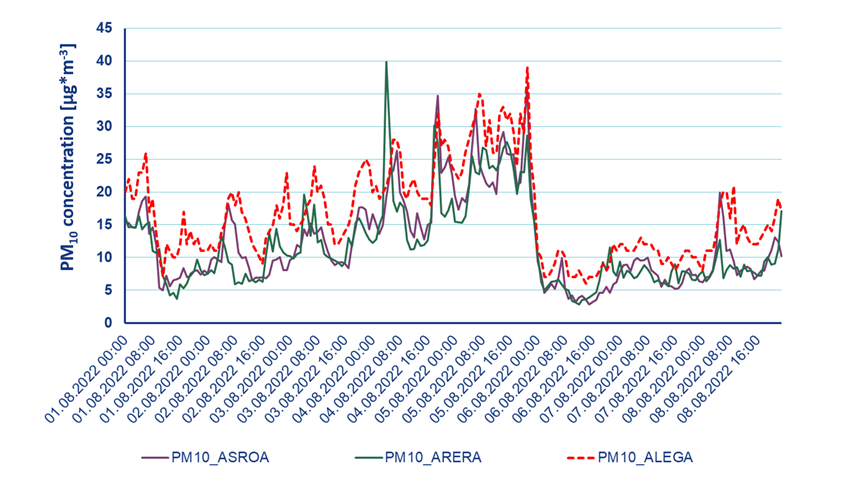 Fig. 7. Course of PM10 concentrations (µg.m-3) measured on 1/8/2022 – 7/8/2022 (MON – SUN) at the reference transport station Prague Legerova (ALEGA), at the urban background station Prague Šrobárova (ASROA) and at the suburban background station Prague Řeporyje (ARERA). All stations measure by the optoelectronic method with equivalent equipment FIDAS200, Palas.
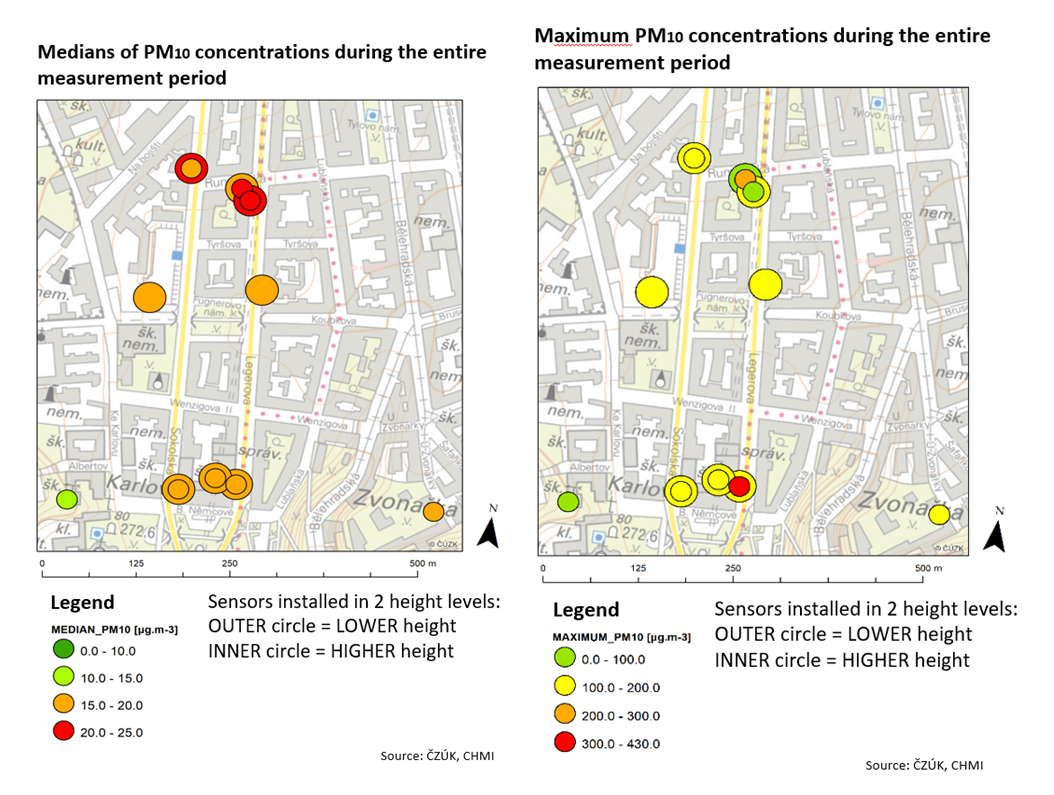 Fig. 8. Map with measurement points showing medians of hourly PM10 concentrations (µg.m-3; left) and maximum hourly PM10 concentrations (µg.m-3; right) detected during the entire measurement period (June 2022 to March 2023). The sensors were placed in two height levels at six locations (see legend). The boundaries of the color scales in the map differ between medians and maxima.
Increased concentrations of PM10 were achieved especially in periods of temperature inversions, when disperse conditions were worsened and negative values of the temperature gradient were recorded from the measurement of the temperature stratification of the atmosphere by a microwave radiometer (see example from September 2022 and December 2022 in Fig. 9).
In July 2022, a large-scale forest fire broke out in the České Švýcarsko National Park, while the aerosol pollution emitted into the air spread across the republic and over greater distances. On July 26, 2022, around 4:00 a.m. and around 9:00 p.m. (UTC), this aerosol pollution also hit Prague, and not only the Prague Legerova reference station, but also the entire sensor network (including background locations) reacted very well to the increase in concentration of suspended particles in the entire area of Prague 2 (Fig. 10).
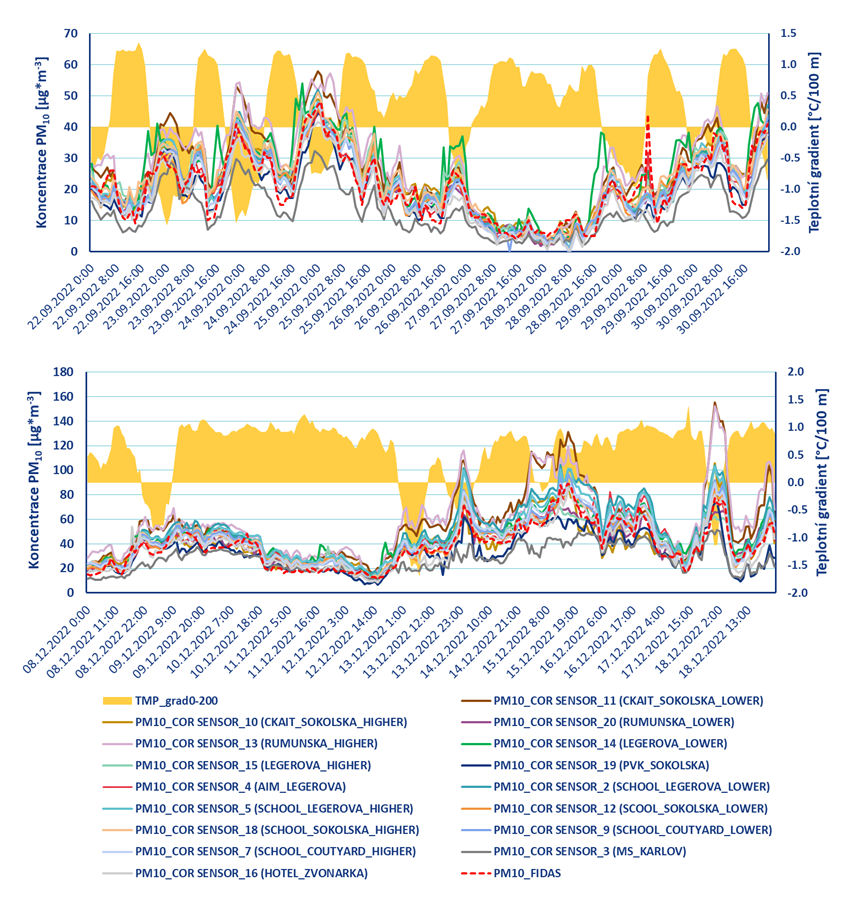 Fig. 9. Course of PM10 concentration (µg.m-3) on 22/09/2022 – 30/09/2022 (top) and 8/12/2022 – 18/12/2022 (bottom), when an increase in PM10 concentrations is evident under conditions of ground temperature inversion (negative temperature gradient, TMP_grad0-200).
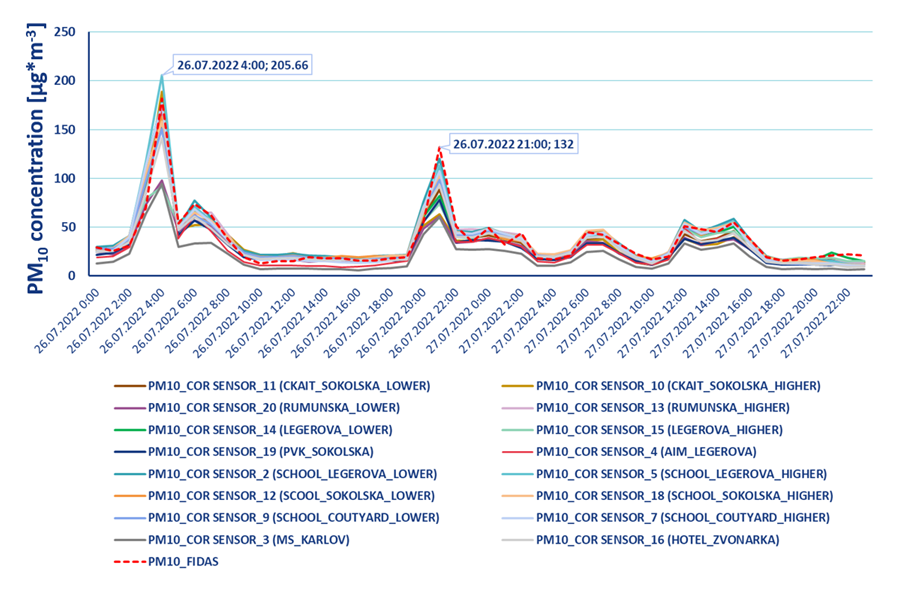 Fig. 10. Response of the sensor network to aerosol pollution transported from a large-scale forest fire in Hřensko on July 26, 2022 in the morning and evening hours.